Last night I wrote about the Callan Periodic Table of Investment Returns (download here). I’m such a big fan of this resource. When I first saw it, I immediately saw the potential to learn from the wealth of information it contained. Yet I wanted to go further than merely examining it and taking it in at face value. I wanted to understand it more clearly.
One of the key features of the periodic table is that it actually lists the yearly performance of each asset class. For example, it tells that Large Cap stocks collectively grew by 21.04% in 1999, and that Non-U.S. Fixed Income lost 3.08% in 2013. I wanted to understand these numbers more fully. I wanted to know how each asset category actually performed year after year. I wanted to know which categories were in the top tier the most. Which ones were first the most? Which were in last the most?
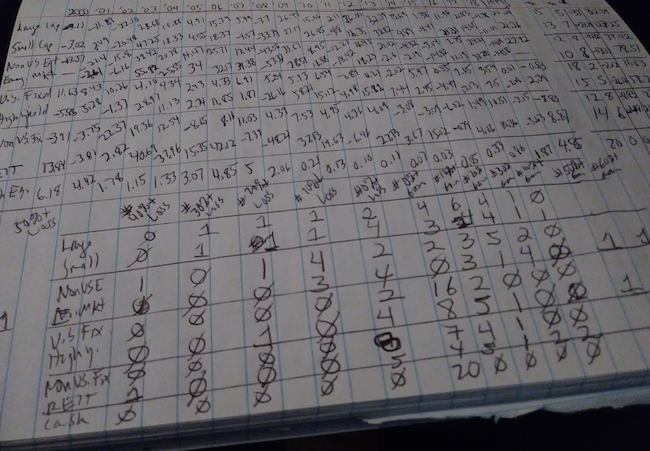
One night several months ago, the analysis began. I started to create my own tables, looking at the data on the periodic table from different points of view. This yielded my insight about REITs. I kept up the analysis on another occasion and came up with the hand-written table that is the featured image for this post.
In the past few days, I have re-upped my study, getting ready for a presentation on the subject. Based on the data on the periodic table, yesterday I ran a simulation of what $10,000 invested back in 1999 for each asset class would yield today. Here are the highlights of what I found (Note: These are my calculations, and I apologize in advance if there are any mistakes in the data. Also, keep in mind this is a completely hypothetical and probably over-simplified simulation. The numbers also assume 0% subtracted for fees):
- Over the past 20 years, REITs have been bad ass. Notwithstanding the financial crisis of 2008-09, (often referred to as the “Real Estate” Crisis), $10,000 invested in global real estate in 1999 would yield $47,009 by the end of 2018!
- Emerging Market stocks have also been incredibly lucrative (though at times incredibly volatile). $10,000 invested in them back in 1999 would have yielded $44,556 by 2018!
- Small-cap stocks offered a surprisingly high return: $10,000 became $42,136.
- Same with High Yield bonds: from $10,000 to $35,598.
- Investing in large cap stocks in 1999 was not the best bet of the pack! With two huge crashes in the next ten years, the S&P 500 suffered tremendously. $10,000 became a “mere” $29,837.
